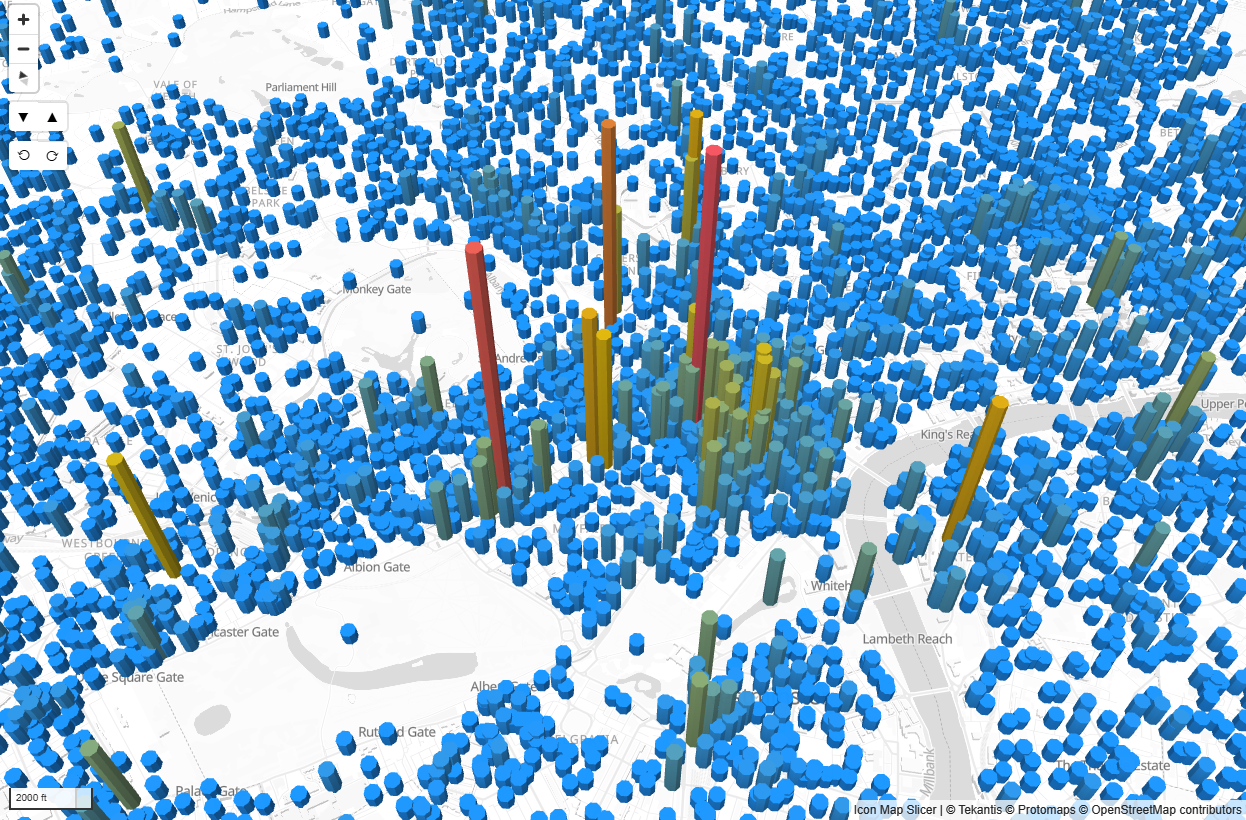
Columns
Icon Map Slicer allows you to display data as 3D columns on the map. Columns can be used to visualise values such as counts, totals, or any other measure that benefits from being represented with height.
Data configuration
To draw columns, the following fields must be configured:
- ID – A unique ID representing that location. This can also be used for drill-down hierarchies.
- Longitude (with aggregation type Average)
- Latitude (with aggregation type Average)
- Column Height – A numeric value determining the height of the column.
Configuration
In the Data Layers card of the formatting options, ensure that Columns is enabled. This will then show the Columns – Configuration and Columns – Formatting cards.
Include in Zoom
Whether these columns are included when using auto zoom. Auto zoom adjusts the map to fit all visible items with this option enabled. Supports conditional formatting.
Allow Selection
Whether columns can be selected to filter or cross-highlight other visuals, or to trigger drill-down or drill-through functionality. Supports conditional formatting.
Include Tooltip
Whether to display a Power BI tooltip when hovering over the column. Supports conditional formatting.
Min Zoom / Max Zoom
The zoom levels at which columns will appear or disappear.
Z-Index
Determines the drawing order relative to other layers. Higher numbers are drawn above lower numbers.
EPSG (Coordinate Reference System)
Specifies the coordinate reference system of your data. The default is 4326 (WGS84 – longitude and latitude). Other EPSG codes can be used, such as 27700 for British National Grid. EPSG codes reference.
Formatting
These options control the shape, size, colour, and transparency of the columns. All can be set using Power BI conditional formatting.
Shape
Determines the cross-section shape of the column:
- Circle – Columns are rendered as cylinders.
- Square – Columns are rendered as rectangular prisms.
Height Behaviour
Determines how the height is calculated:
- Relative – Heights are scaled between the Min Height and Max Height values, based on the range of values in the dataset.
- Absolute – Heights are based directly on the values in the data, in map units.
Min Height / Max Height
When using Relative height behaviour, these values define the smallest and largest heights of the columns.
Width
The width of the column base, in map units or pixels (depending on the chosen rendering mode). Supports conditional formatting.
Color
The fill colour of the columns. Supports conditional formatting.
Transparency
A value between 0 and 100, where 0 is fully opaque and 100 is fully transparent.
Example Uses
- Displaying population counts per location as column heights.
- Showing sales volumes for regions on a geographic map.
- Visualising sensor readings where the height corresponds to measurement values.